Average vs Median Placement: The One Number That Can Change Your College Decision
The One Number Colleges Don't Want You to Focus On
Every year, as placement season kicks off across India, a familiar set of headlines dominates college brochures, news portals, and WhatsApp groups: "College X Records Highest Ever Average Package of ₹15 LPA!" For students and parents comparing colleges, this single number becomes the ultimate benchmark. It shapes decisions worth lakhs of rupees in tuition fees and years of a student's life.
But here is the uncomfortable truth that most colleges will never tell you: the "average placement" number is one of the most misleading statistics in Indian education. A single outlier salary can dramatically inflate the average, painting a picture that does not reflect what most students actually experience.
In this guide, we will break down exactly how this works — with a real example, actual IIM data, and a practical checklist of questions you should be asking instead.
Understanding the Basics: What Is Average vs. Median?
Before we dive into the example, let us quickly clarify what these two terms mean in the context of placements.
| Metric | How It Is Calculated | What It Tells You |
|---|---|---|
| Average (Mean) | Add up all salaries and divide by total number of students | The mathematical center of all salaries — heavily influenced by extreme values |
| Median | Arrange all salaries in order and pick the middle value | What the "middle student" actually earns — not affected by outliers |
The average is what colleges love to advertise because it sounds impressive. The median is what you should actually care about because it represents the realistic outcome for a typical student.
The Real Example: A Batch of 10 Students
Let us consider a hypothetical — but extremely common — scenario at an Indian engineering college. A batch of 10 students goes through campus placements, and here are the results:
| Student | Placement Status | Annual Package (₹) |
|---|---|---|
| Student 1 | Not Placed | ₹0 |
| Student 2 | Not Placed | ₹0 |
| Student 3 | Not Placed | ₹0 |
| Student 4 | Not Placed | ₹0 |
| Student 5 | Not Placed | ₹0 |
| Student 6 | Placed (Domestic) | ₹3,00,000 |
| Student 7 | Placed (Domestic) | ₹3,00,000 |
| Student 8 | Placed (Domestic) | ₹3,00,000 |
| Student 9 | Placed (Domestic) | ₹3,00,000 |
| Student 10 | Placed (Abroad) | ₹1,50,00,000 |
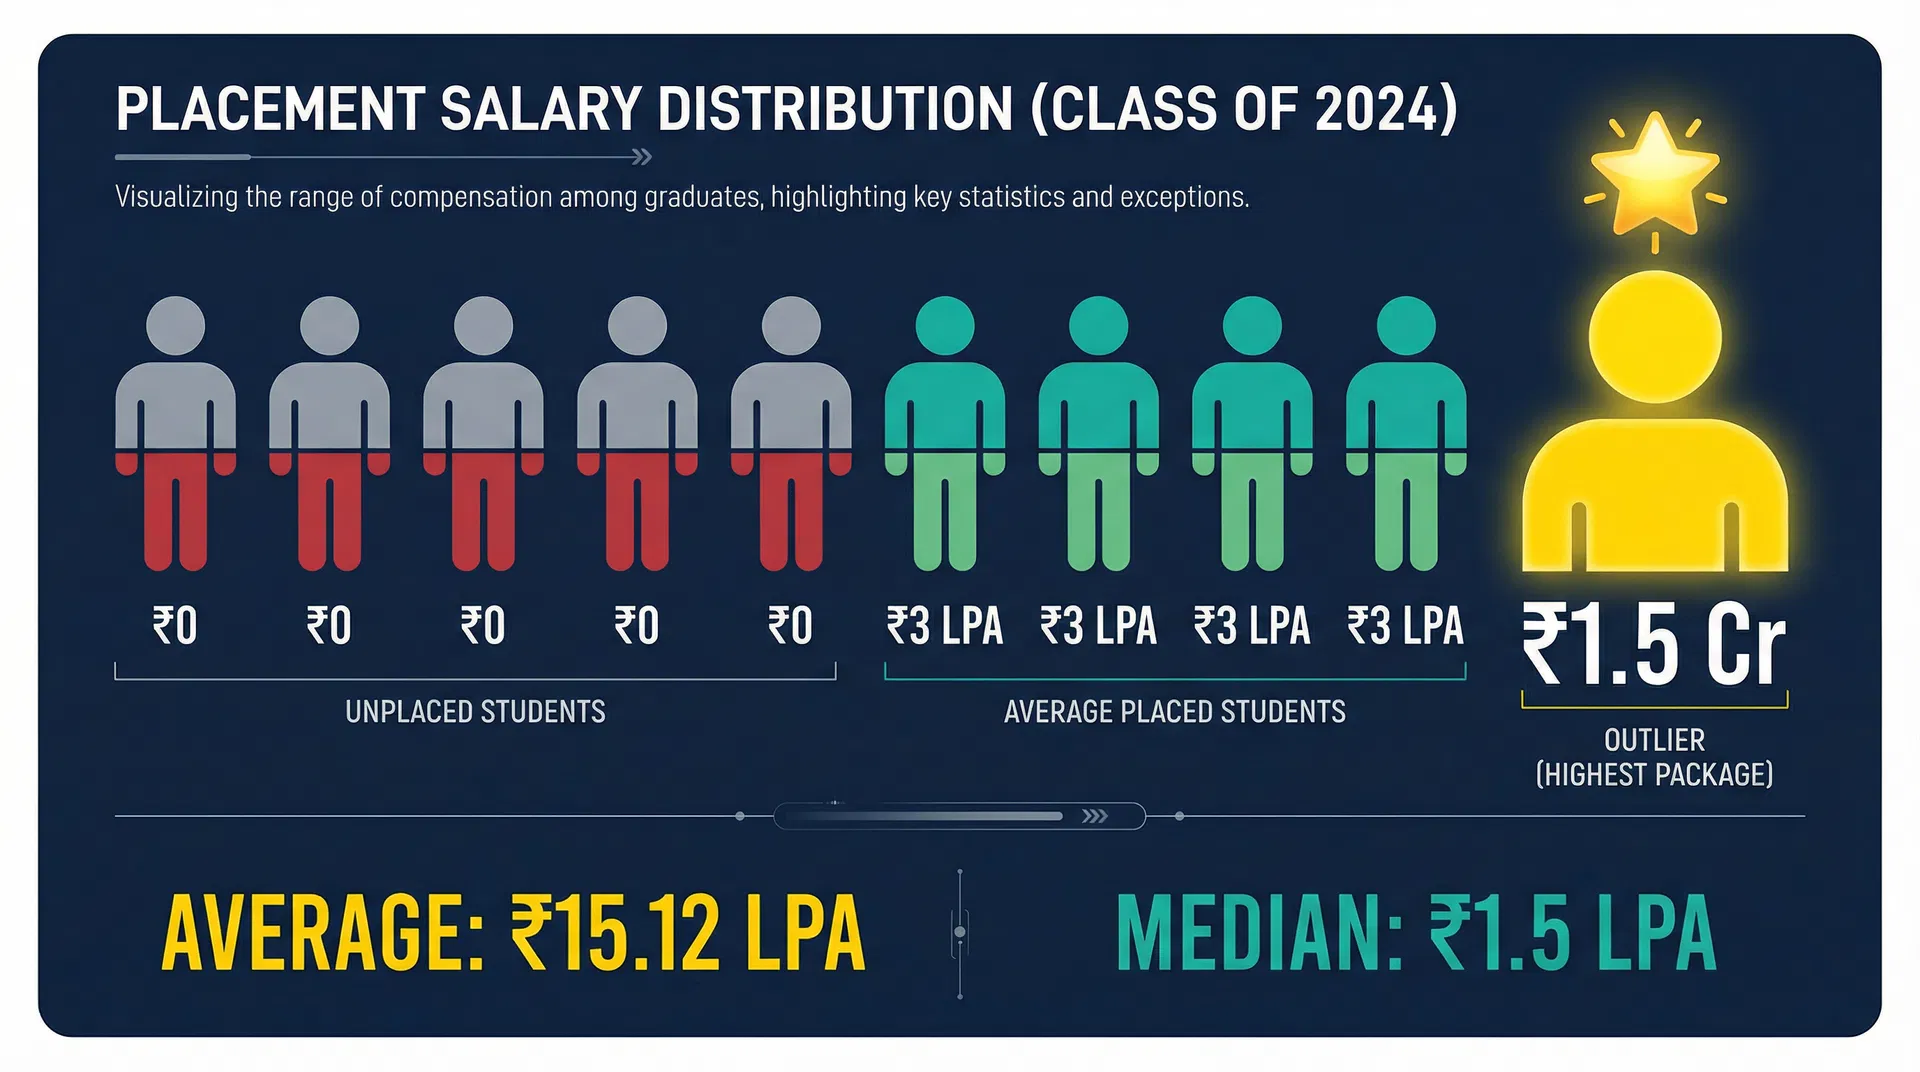
Five students got nothing. Four students got a decent ₹3 LPA. And one student landed a dream placement abroad with a package equivalent to ₹1.5 Crore in Indian terms. This pattern — a handful of unplaced students, a majority at modest salaries, and one or two outliers — is far more common in Indian colleges than most people realize.
The Math: How One Outlier Destroys the Average
Now let us do the calculation that the college's marketing department loves:
Total salary pool: ₹0 + ₹0 + ₹0 + ₹0 + ₹0 + ₹3,00,000 + ₹3,00,000 + ₹3,00,000 + ₹3,00,000 + ₹1,50,00,000 = ₹1,62,00,000
Average (Mean): ₹1,62,00,000 ÷ 10 = ₹16,20,000 (approximately ₹16.2 LPA)
Median: When you arrange all 10 salaries in order, the middle values (5th and 6th) are ₹0 and ₹3,00,000. The median is ₹1,50,000 (₹1.5 LPA).
Let that sink in:
The college advertises: "Average placement ₹16.2 LPA" Reality for 9 out of 10 students: ₹0 to ₹3 LPA Median placement: ₹1.5 LPA
That single ₹1.5 Crore package pulled the average up by over 10x from what most students actually earned. The college is not technically lying — the average really is ₹16.2 LPA. But it is profoundly misleading.
Average vs. Median: A Side-by-Side Comparison
| Factor | Average (Mean) | Median |
|---|---|---|
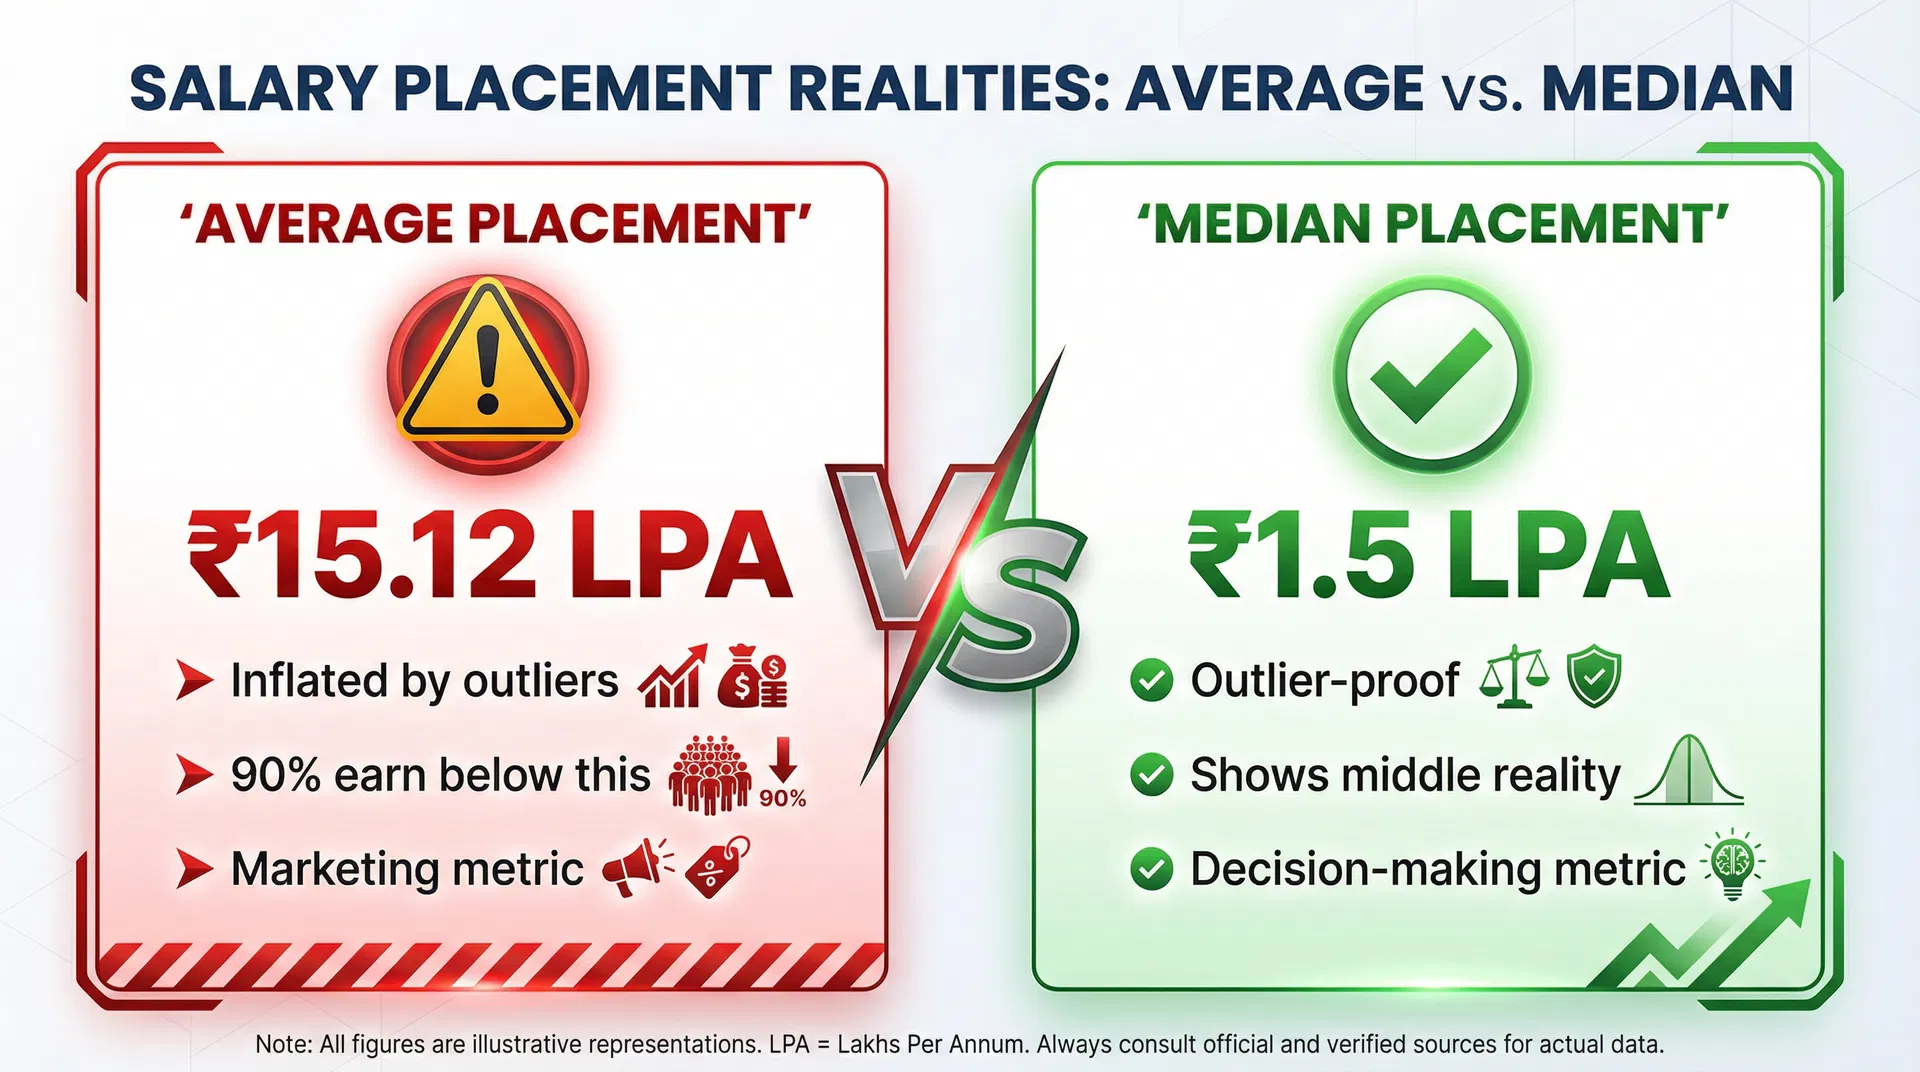
| Value in our example | ₹16.2 LPA | ₹1.5 LPA |
| Affected by outliers? | Heavily — one ₹1.5 Cr salary skews everything | Not at all — it only looks at the middle value |
| What it represents | Mathematical center (can be far from reality) | What the typical "middle" student actually earns |
| Used by colleges because | It sounds impressive in brochures | It would reveal the uncomfortable truth |
| Best for | Marketing | Decision-making |
| Red flag indicator | When average is much higher than median | When both are close, the data is healthy |
The bottom line: If 9 out of 10 students earn below the "average," that number is not representing your likely outcome. The median is.
Real Data: How Top IIMs Report Both Numbers
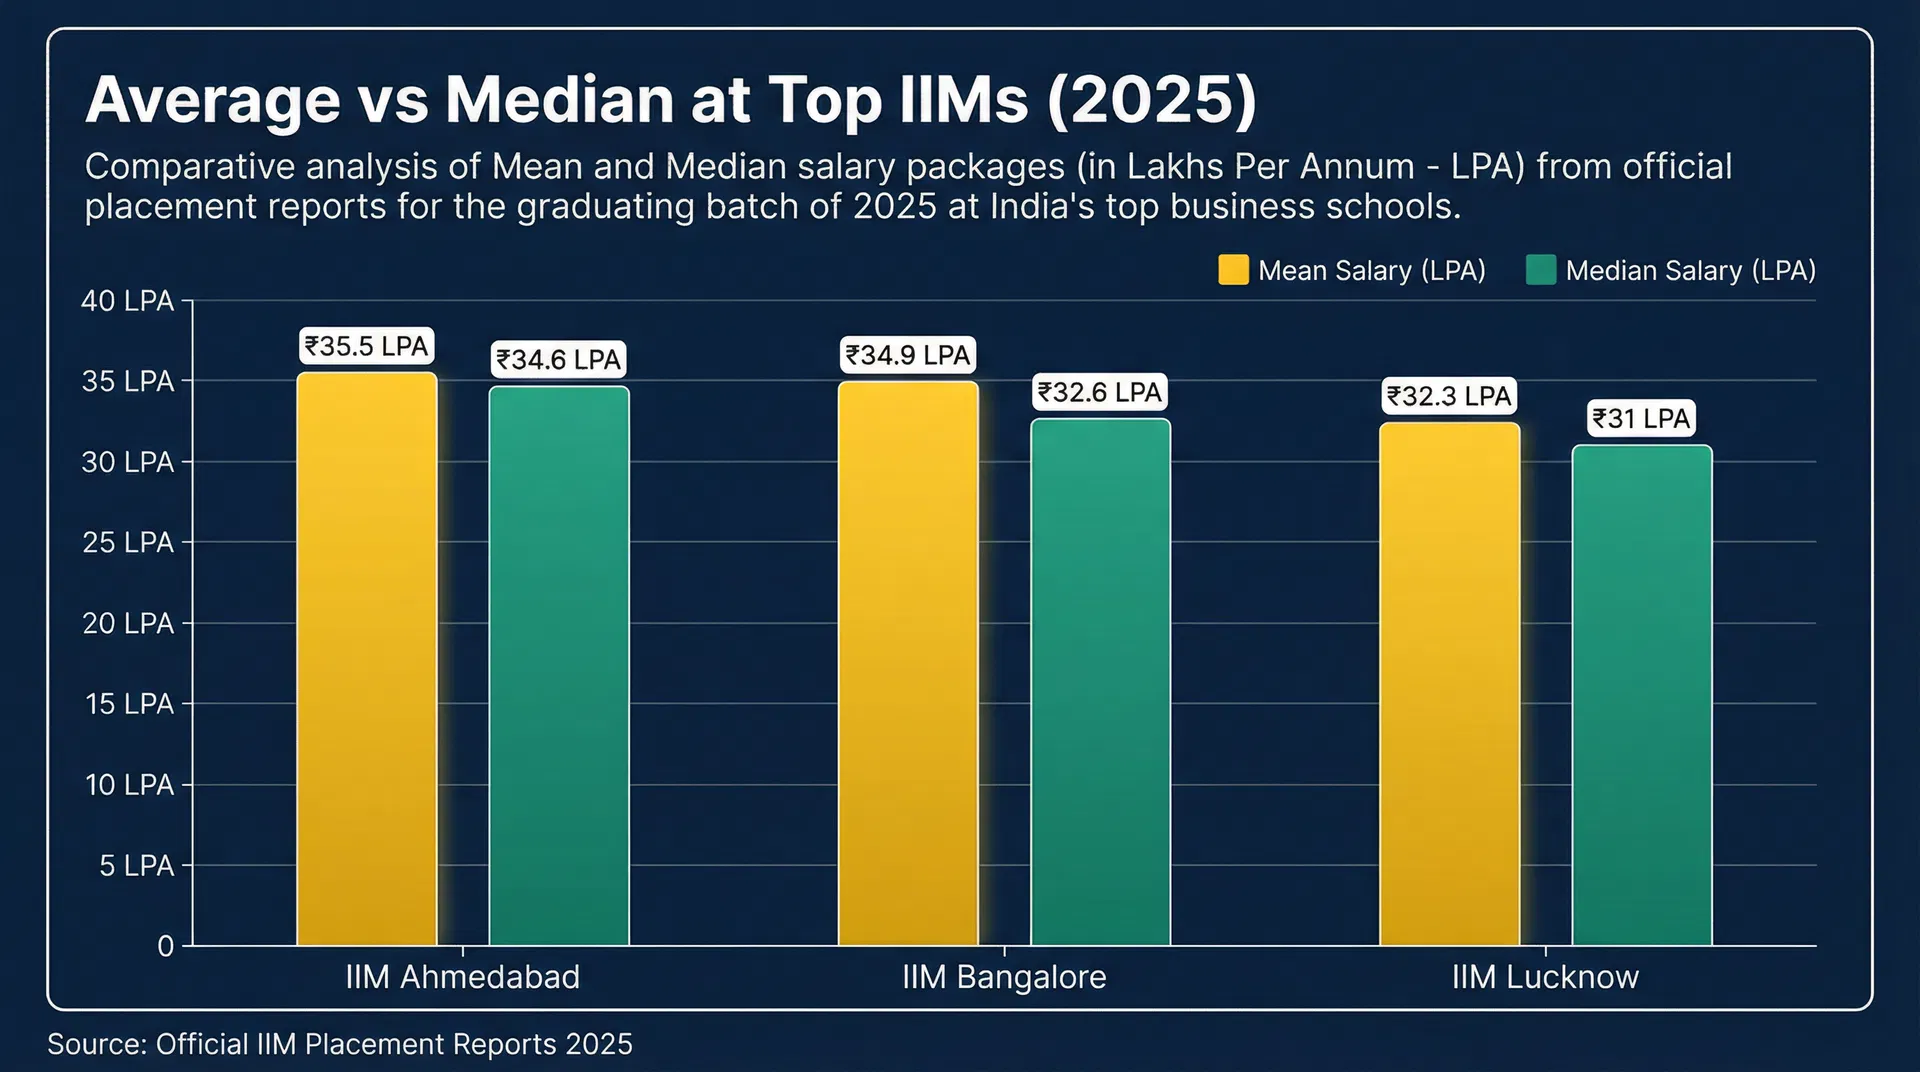
To their credit, India's top business schools like the IIMs have started reporting both average and median placement figures. Here is what the official 2025 placement reports show:
| Institution | Mean (Average) Salary | Median Salary | Gap |
|---|---|---|---|
| IIM Ahmedabad | ₹35.50 LPA | ₹34.59 LPA | ₹0.91 LPA (2.6%) |
| IIM Bangalore | ₹34.88 LPA | ₹32.61 LPA | ₹2.27 LPA (6.5%) |
| IIM Lucknow | ₹32.30 LPA | ₹31.00 LPA | ₹1.30 LPA (4.0%) |
Source: Official IIM Placement Reports 2025 (IIM Ahmedabad IPRS Report, IIM Bangalore Placement Report, IIM Lucknow via IMS India)
Notice how at the top IIMs, the gap between average and median is relatively small (2-7%). This is a sign of a healthy placement ecosystem — most students are earning close to the advertised average. The data is not being distorted by a few extreme outliers.
Now contrast this with a typical tier-2 or tier-3 engineering college where the average might be ₹8 LPA but the median could be ₹3-4 LPA — a gap of 50% or more. That gap is the red flag you need to watch for.
Key insight: When the gap between average and median is small (under 10%), the average is a reliable indicator. When the gap is large (over 20-30%), the average is being inflated by outliers and should not be trusted as your expected outcome.
The Tricks Colleges Use to Inflate Placement Numbers
Beyond the average vs. median issue, there are several other ways colleges can make their placement numbers look better than reality:
1. Counting CTC instead of in-hand salary. CTC (Cost to Company) includes employer contributions to PF, gratuity, insurance, and sometimes even variable bonuses that may never materialize. A ₹6 LPA CTC might translate to just ₹3.5-4 LPA in-hand salary.
2. Excluding unplaced students from the calculation. Some colleges calculate "average placement" only among students who were actually placed, conveniently ignoring the 30-50% who received no offers at all.
3. Including internship stipends and part-time roles. A 3-month internship stipend of ₹15,000/month gets annualized to ₹1.8 LPA and counted as a "placement."
4. Counting the same student multiple times. If a student receives 3 offers, some colleges count all 3 in their placement statistics, inflating both the placement rate and the average salary.
5. Reporting "highest package" prominently. The ₹1.5 Crore package gets a full-page feature in the brochure, while the fact that 50% of students were not placed gets buried in fine print — if it is mentioned at all.
5 Questions Every Student and Parent Must Ask
Before choosing a college based on placement data, arm yourself with these five questions:
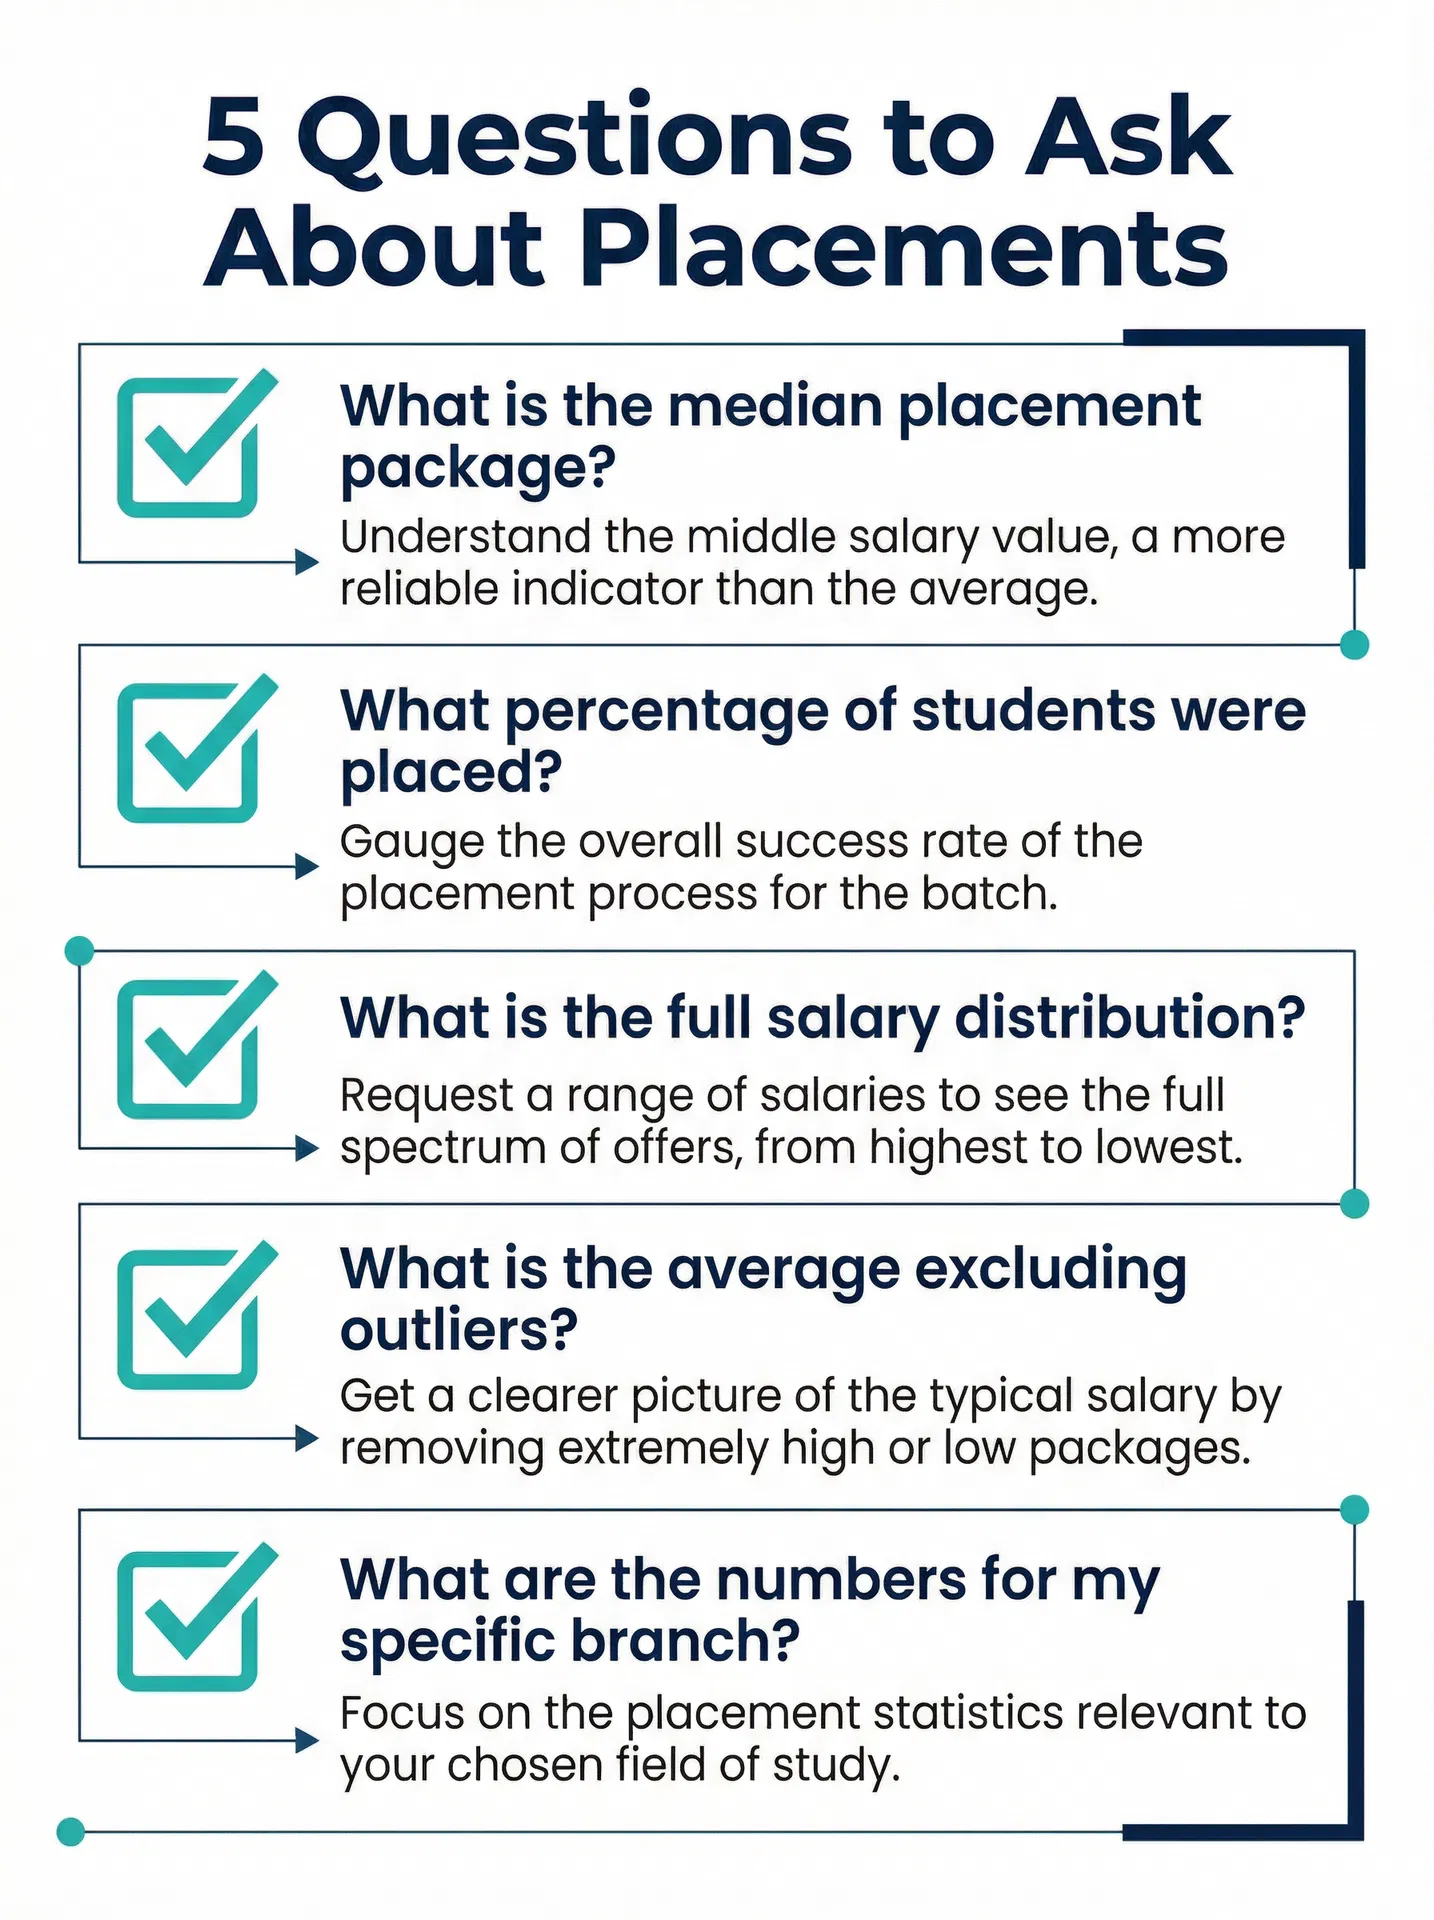
1. "What is the MEDIAN placement package?"
Not the average. Not the highest. The median. This single number tells you what the student standing exactly in the middle of the batch earned. If a college refuses to share this or claims they "don't track it," that itself is a red flag.
2. "What percentage of students were actually placed?"
A college can claim a ₹10 LPA average, but if only 40% of students were placed, the other 60% earned ₹0. The effective average for the entire batch drops dramatically. Always ask for the placement rate alongside the salary figures.
3. "Can you share the full salary distribution?"
Ask for a breakdown: How many students got 0-3 LPA? How many got 3-6 LPA? 6-10 LPA? 10+ LPA? This distribution tells you far more than any single number ever could. A college with 80% of students in the 5-8 LPA range is far more reliable than one with 20% at 15+ LPA and 50% at 0-3 LPA.
4. "What is the average EXCLUDING the top and bottom 5%?"
This is called the "trimmed mean" and it removes the effect of both extreme outliers (the ₹1.5 Cr international offer) and the unplaced students. The resulting number gives you a much more realistic picture of what a typical placed student earns.
5. "What are the numbers for MY specific branch/department?"
College-wide placement numbers hide enormous differences between departments. The Computer Science department might have a 95% placement rate with ₹12 LPA median, while the Mechanical Engineering department at the same college might have 40% placement with ₹4 LPA median. Always ask for branch-specific data.
Pro Tip: A college that shares median placement data openly is likely more honest and confident about their outcomes. Transparency is a sign of quality.
The Ideal Approach: Use Both Numbers Together
We are not saying you should completely ignore the average. The ideal approach is to look at both numbers together and understand what the gap between them tells you:
| Scenario | Average | Median | Gap | What It Means |
|---|---|---|---|---|
| Healthy | ₹8 LPA | ₹7.5 LPA | 6.7% | Most students earn close to the average — reliable data |
| Moderate concern | ₹12 LPA | ₹8 LPA | 33% | Some outliers are pulling the average up — ask for distribution |
| Red flag | ₹15 LPA | ₹3 LPA | 80% | Average is driven by a few extreme salaries — do not trust it |
When the gap between average and median is under 10%, you can reasonably trust the average. When it exceeds 20-30%, the average is a marketing number, not a reflection of your likely outcome.
What NIRF Rankings Are Doing Right
India's National Institutional Ranking Framework (NIRF) has taken a positive step by requiring institutions to report median salary in their data submissions. This is a significant improvement over the earlier system where only average figures were reported.
However, many colleges still prominently advertise only the average in their marketing materials, even if they submit median data to NIRF. As a student or parent, you can check a college's NIRF submission data to find the median salary — it is publicly available on the NIRF website.
Your College Decision Checklist
Before finalizing your college choice, make sure you have answers to all of these:
- Median placement salary for your specific branch
- Overall placement percentage (not just "eligible" students)
- Full salary distribution (how many students in each salary bracket)
- CTC vs. in-hand salary breakdown
- Placement data for the last 3 years (not just the best year)
- Number of students who opted out of placements vs. those who were not placed
- Average salary excluding top and bottom 5% (trimmed mean)
- Companies that visited campus and the roles they offered
The Bottom Line
Average placement is a marketing number. Median placement is your reality check.
The next time you see a college brochure proudly displaying "Average Package: ₹15 LPA," do not get swept up in the excitement. Ask for the median. Ask for the distribution. Ask for the placement percentage. The answers to these questions will tell you far more about your actual prospects than any single average number ever could.
A college that is truly confident in its placement record will have no problem sharing all of these numbers. One that hides behind a flashy average might be hiding an uncomfortable truth.
Choose with data, not hype.
At AI Career Insight, we believe in empowering students with honest, data-driven career guidance. Use our AI Resume Builder to create an ATS-compliant resume that maximizes your placement chances, and explore our career guidance tools to make informed decisions about your future.